Summary
One of the most common yet tricky performance issues to diagnose in virtualization environments is CPU contention—a condition where a VM’s virtual CPUs (vCPUs) are ready to execute tasks but must wait for access to physical CPU resources. We’re excited to announce that XenServer is introducing new CPU runnable metrics, giving you unprecedented visibility into CPU contention. These metrics will help you:
- Pinpoint CPU scheduling bottlenecks
- Optimize resource allocation
- Ensure critical workload run at peak performance
Why Is CPU Contention a Hidden Problem?
Traditionally, it has been difficult to quantify how much a VM’s performance suffers from limited access to physical CPU time. High CPU utilization doesn’t always mean a VM is CPU-starved.
A VM may appear moderately utilized while still struggling to get scheduled on a physical CPU. This happens when its vCPUs spend time in a runnable state—ready to run, but waiting for the Xen Hypervisor to schedule them.
These new metrics bring clarity to that gray area, similar to the well-known “CPU Ready Time” metric in other virtualization platforms. They move you from guesswork to data-driven performance tuning.
Two New Metrics to Understand CPU Contention
Available in XenServer (from the normal channel update on or after October 1st) and XenCenter (version 2025.03 or later), these two metrics provide both early warnings and deep insights into CPU scheduling contention.
| Metric | Purpose | Interpretation |
|---|---|---|
| vCPUs runnable any | Early warning | Indicates whether any vCPU was waiting for CPU time |
| vCPUs runnable sum | Severity insight | Shows how many vCPUs were runnable and for how lon |
1. vCPUs runnable any
What it tells you:
This metric is your early warning indicator. It measures the percentage of time during which at least one vCPU in a VM was ready to run but couldn’t get physical CPU time.
2. vCPUs Runnable Sum
What it tells you:
While “vCPUs runnable any” indicates if any vCPU is waiting, the vCPUs runnable sum shows the severity of contention—how many vCPUs were runnable and for what proportion of time.
In other words:
- If vCPUs runnable any > 0, it means at least one vCPU couldn’t get CPU time (a mild contention).
- If vCPUs runnable sum is high, it means multiple vCPUs are frequently waiting—indicating more severe CPU pressure.
This metric helps you differentiate between occasional scheduling delays and sustained CPU bottlenecks that may affect application responsiveness.
How to enable it:
- Open XenCenter.
- Select a VM and navigate to the Performance tab.
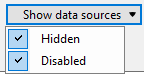
- Select “Hidden” and “Disable” under “Show data sources.”
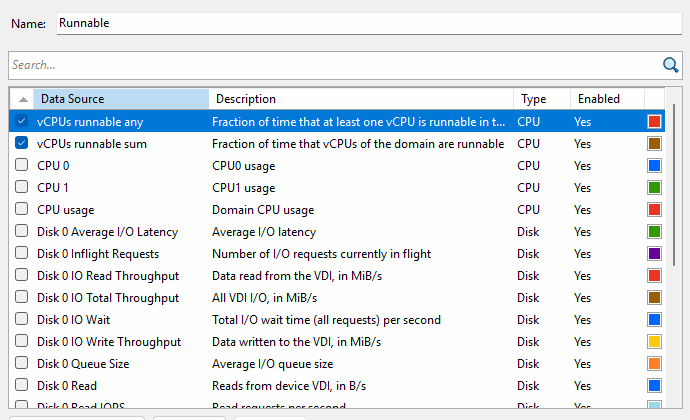
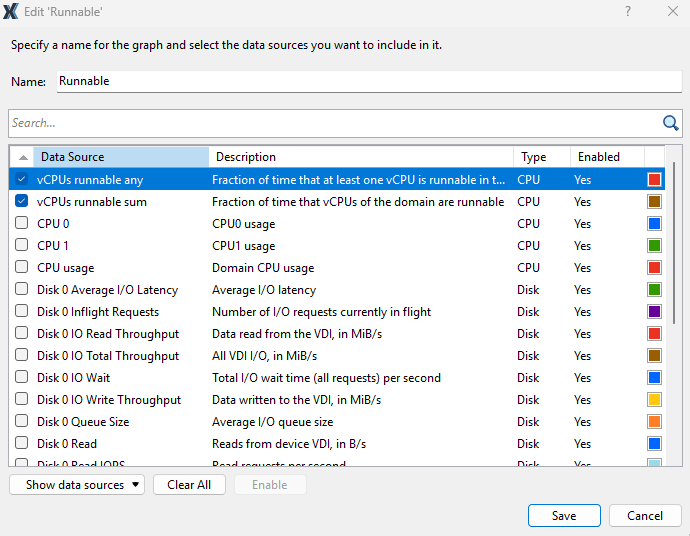
- Add a new graph and select two data sources:
- vCPUs runnable any – Fraction of time during which at least one vCPU is runnable.
- vCPUs runnable sum – Fraction of total vCPUs that are runnable.
- Save and add the chart to start monitoring.
With these new CPU runnable metrics, XenServer provides administrators with clearer visibility into what’s really happening inside their virtual environments. Instead of relying solely on CPU utilization, you can now detect early signs of CPU contention, quantify its severity, and take proactive steps to optimize performance.
Even more innovations in XenServer are on the way—stay tuned!