The XenServer hypervisor contains a considerable number of internal components that work together to provide an efficient virtualization platform.
- The benefits of distributed tracing to observe and debug a complex system as XenServer
- How a user can enable and benefit from it
- How a partner can integrate with it using the W3C TraceContext HTTP header standard in the XenAPI
The XenServer hypervisor contains a considerable number of internal components that work together to provide an efficient virtualization platform. With it, the resources of the same physical host machine and corresponding devices can be time-shared across concurrent Virtual Machines, increasing the value of your hardware, and providing new virtualization features like Live Migration for very long uptime of guest Operating Systems that outlive their host machines.
As a platform (see Fig.1), the XenServer hypervisor integrates with a myriad of different external components. They use APIs and standard protocols to act either as upstream users that drive the XenServer behaviour (for instance I/O requests from inside the guests and orchestration products like the XenCenter UI, Citrix Virtual Apps and Desktops (CVAD) or administrator scripts that access the XenAPI), or downstream services to XenServer that provide external resources (for instance remote storage over the network, authentication services or additional pools of XenServer hosts).
These internal and external components provide a rich ecosystem, where customers and partners can augment the overall collective value of this virtualization platform by providing their own components – either by providing new upstream orchestration mechanisms or downstream external resources, or by participating in the development of the internal XenServer components to provide new core virtualization features.
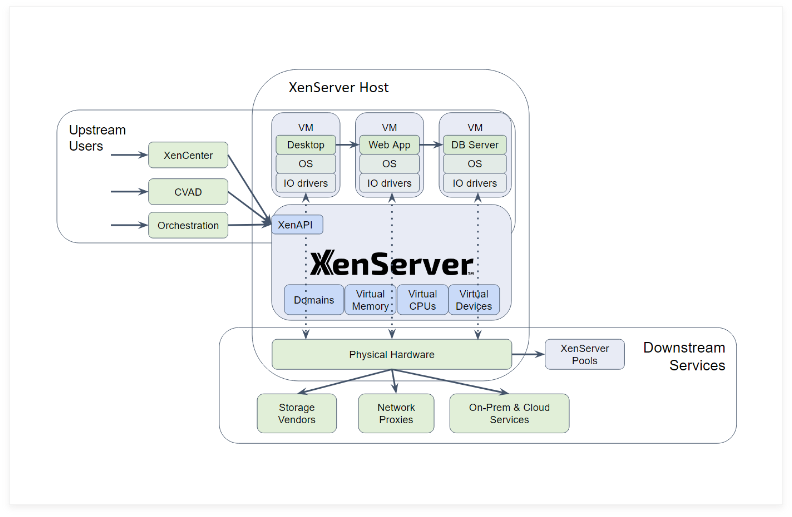
Figure 1: The XenServer hypervisor platform ecosystem integrates internal components (blue) and external components (green). Distributed Tracing (arrows) can connect them all together, linking observations of user-visible unexpected behaviour to specific actions in a component, facilitating actionable refinements between different teams and components in the ecosystem.
Observing the growing future of the XenServer platform ecosystem with Distributed Tracing
The XenServer team is actively working to use industry-wide Observability standards like Distributed Tracing to facilitate the growing teams of users, customers and partners to generate actionable refinements amongst themselves from observations that deviate from the expected user-visible behaviour. This end-to-end connection between high-level user-visible behaviour and an action in a component is crucial to accelerate the evolution of improvements in the ecosystem. The original inspiration was the increasingly-used Observability standards like the OpenTelemetry Distributed Tracing that the cloud community already uses to tackle similar problems in the ever-growing interweaving web of virtualized micro-apps and service components in the cloud. Implementing Distributed Tracing inside the XenServer platform ecosystem will complete the end-to-end connections between these virtualized components in the cloud and the XenServer platform components, including downstream hypervisor dependencies like storage vendors, network proxies and on-prem & further downstream services – creating a complete end-to-end picture between user-visible behaviour of virtualized apps, desktops and services and the specific component in the full virtualization stack that needs to be refined to drive the desired update to the user-visible behaviour (see fig. 1).
Furthermore, the use of Observability in the XenServer platform ecosystem also helps newcomers to onboard the details of different components from different teams, as the current real-time behaviour between the components is explicitly captured for each user-visible action. And it also helps seasoned developers, users and administrators to keep up with the latest changes in the components, as the current real-time architecture between the components in the ecosystem is also explicitly captured, replacing outdated documentation. When following the connections between actions in the guest and actions in the hypervisor, for example, justifying a user-visible slowdown of a file copy operation inside a guest becomes easier as it is possible to connect this operation inside the guest to a potential performance bottleneck in the external storage server component used by the hypervisor, or perhaps to a recent change to a specific function in the product code. Data scientists can use the captured connections to isolate and delegate the anomaly detected from a specific user-visible action to the team responsible for the corresponding component in the ecosystem.
Finally, following Observability standards like OpenTelemetry imply that users, customers and partners of the XenServer platform ecosystem can easily integrate existing Distributed Tracing tools, instrumentation libraries, languages and services already developed by the engineering and data-science community surrounding these standards to their own processes and products (see fig. 2). As an example, the XenAPI in XenServer now accepts the W3C TraceContext HTTP header fields traceparent and tracestate for each request, propagated from an external orchestration component, to set its own Distributed Tracing trace-id and parent-id context for the actions in the internal XenServer components. These values will be additionally propagated to external downstream components, and also collected for further analysis when a XenServer administrator enables the new Observer object in the XenAPI. As another example, to propagate these headers to XenServer from upstream orchestration components, or accept them from downstream services, a XenServer platform ecosystem partner could use the tracing context propagation capabilities in a distributed tracing instrumentation library for their preferred language.
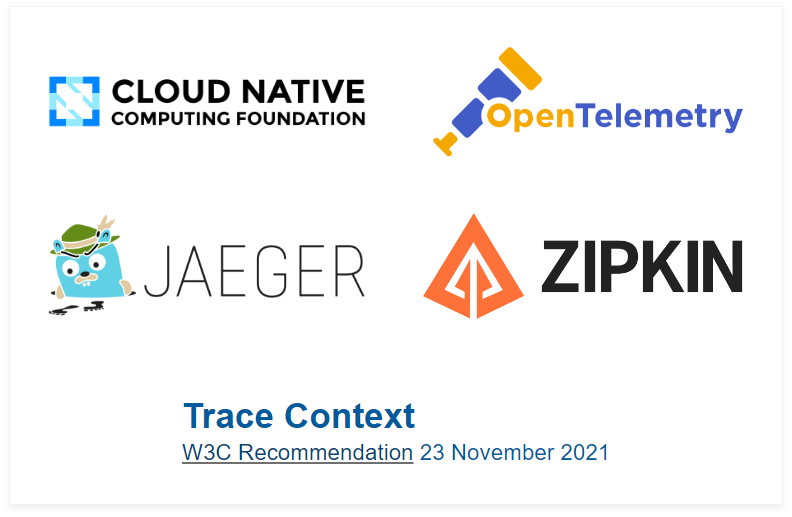
Figure 2: There are several existing industry-wide tools, libraries, standards and services built around Observability and Distributed Tracing, a few examples discussed in this text are listed here.
Distributed Tracing vs Logging vs Metrics
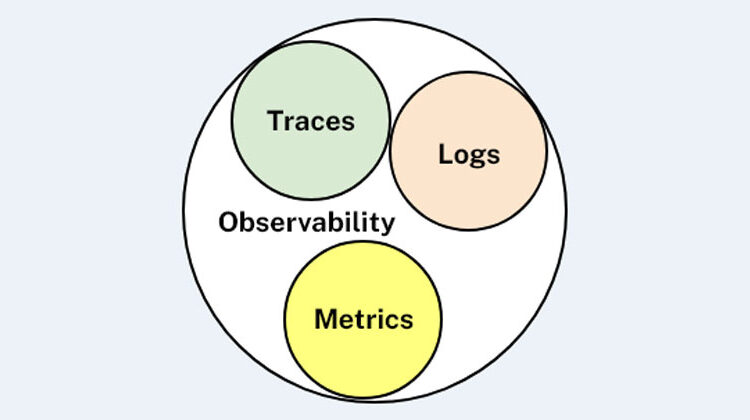
Observability is more than Distributed Tracing. It contains other observable aspects such as Logging and Metrics.
- Logging collects single events with one timestamp (aka Log Record), which contains an attached description of a state of a component, at a specific point in time, during an activity.
- Metrics collects summaries of several activities of a component (aka Measurement), for instance the total amount of CPU time used by the activities every second.
- Tracing collects single named activities with two well-defined begin and end timestamps (aka Spans), which contains a context used to propagate a parent-child connection between the activities. When we propagate the tracing context across different components and teams, we obtain Distributed Tracing (see fig. 3).
Tracing is arguably the most expressive of the three observability aspects above: we can automatically aggregate spans to generate a measurement, and automatically separate the begin end timestamps of a span to generate log records. But the opposite is not true: we cannot automatically join individual log records to generate a span, as the begin/end/name information of a span is not generally available from a log record, and we cannot automatically un-summarize a measurement into the original spans used to generate the measurement. For this reason, when we create an Observer object in XenServer (see next section), this Observer object will sample Spans in the initial implementation. In the future, we may also additionally forward the existing Log Records and Measurements in XenServer into the Observer object for a more modern Observability framework to collect and manipulate these other observable aspects in XenServer, and/or calculate them from the newly sampled Spans.
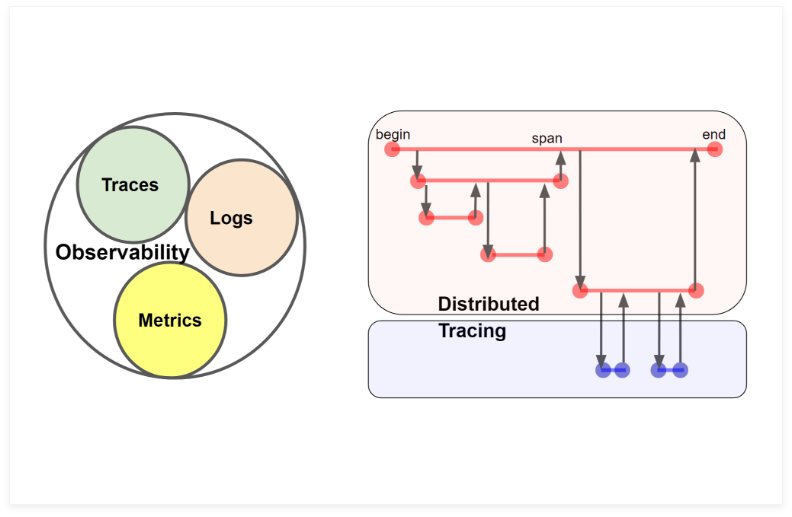
Figure 3: Tracing is one of aspects of Observability, together with Logging and Metrics, and Distributed Tracing can connect traces of activity produced by different components (red and blue) from different teams. Each sampled activity (individual horizontal bar with well-defined begin and end events) is called a span.
Enabling Distributed Tracing in XenServer
The initial implementation of Observability in XenServer encapsulates the OpenTelemetry Distributed Tracing API standard to a new handy object in the XenAPI called Observer. To create a new Observer object across all the hosts in a XenServer pool, you can use the following XenServer xe cli command (or corresponding XenAPI RPC request):
xe observer-create
    name-label=<some_meaningful_name_for_this_object>
    enabled=true|false
    endpoints=bugtool|<http_endpoint>|...
    components=xapi|xenopsd|...
Comments regarding the command above:
- It will return a new random UUID for the new Observer object. This UUID can be used to manipulate the Observer object further.
- The required parameter name is going to be stored in the attribute named ‘xs.observer.name’ of each observed span. This is useful to filter or visualize in external tools only the samples collected by this Observer object. It’s possible to set further attributes in each collected span by running ‘xe observer-param-set uuid=<UUID> attributes:<my_key>=<my_value>’.
- If the parameter ‘enabled=false’, then the Observer object is created but will only start sampling/collecting spans after a follow-up xe cli command ‘xe observer-param-set uuid=<UUID> enabled=true’. Conversely, you can stop sampling/collecting spans after running ‘xe observer-param-set uuid=<UUID> enabled=false’.
- If the parameter ‘endpoints’ is not provided, then it will default to the value ‘bugtool’. The ‘bugtool’ value will collect sampled spans to a dom0 directory inside /var/log/dt. This directory is checked every hour and any collected samples going beyond total size 100MB or older than 30 days are trimmed. Additionally, it’s possible to provide a remote endpoint over the network to receive the collected samples. In this initial implementation, this remote http endpoint needs to be compatible with the zipkin-v2 format, for instance the Jaeger all-in-one UI appliance. If you provide for instance ‘endpoints=bugtool,http://<my-jaeger-ui-vm-ip>:9411/api/v2/spans’ ,then the Observer object will collect the sampled spans to both the dom0 directory above and to this remote Jaeger UI endpoint, which can be set up beforehand by running ‘docker run -d –name jaeger -e COLLECTOR_ZIPKIN_HTTP_PORT=9411 -p 5775:5775/udp -p 6831:6831/udp -p 6832:6832/udp -p 5778:5778 -p 16686:16686 -p 14268:14268 -p 9411:9411 jaegertracing/all-in-one:1.6’ in your laptop or some Linux VM. In this case, after executing further XenAPI or xe-cli requests, you can then visualize the collected XenServer Distributed Tracing data by pointing your web browser to http://<my-jaeger-ui-vm-ip>:16686/ .In this initial implementation, the data is collected using the zipkin-v2 format as this format has a simple textual serialization format that simplified this initial implementation, and is compatible with a reasonable initial number of external analysis and visualization tools. In the future, we plan to support using different .proto files to serialize the sampled spans to different textual and binary formats.
- If the parameter ‘components’ is not provided, it defaults to ‘all’. Otherwise, currently only the values ‘xapi’ and ‘xenopsd’ are accepted, and this list should quickly increase in the future with more internal components in XenServer.
An example of the samples collected during a VM.start operation executed by XenCenter or by ‘xe vm-start’ can be seen in figure 4.
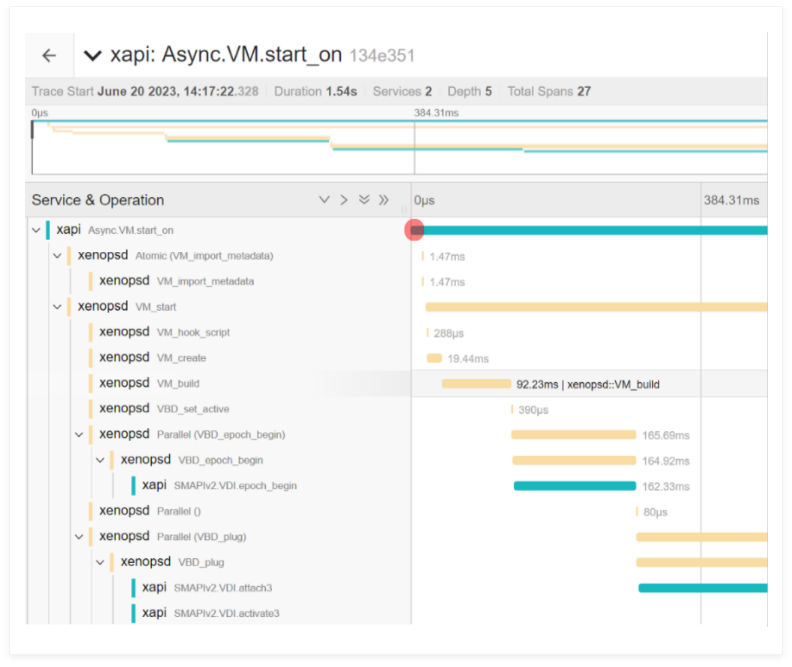
Figure 4: An example output using the Jaeger UI of a VM.start span operation in XenServer after Distributed Tracing was enabled using the instructions above. It’s possible to see the different components and activities sampled inside the top-level VM.start operation started by the user using XenCenter.
Integrating your app, tool or service with the XenServer platform observability ecosystem
In this initial implementation, you can integrate the observability aspects of your orchestration app, tool or service to the XenServer platform components by passing the standard W3C TraceContext HTTP header fields traceparent and tracestate, for each request you send to the XenAPI. If you are using one of the OpenTelemetry Distributed Tracing libraries, this may be as simple as enabling the context propagator for your specific instrumentation library for your language.
The example in figure 5 shows how to accomplish this context propagation to the XenAPI directly using Python, in case you are not using an instrumentation library.
import xmlrpc.client
partner_trace_id        = "3100a3ead5c4210a99c27e3e5578158c" # random 32-hex digits
partner_request_span_id = "34991b6261208b64"                 # random 16-hex digits
partner_name            = "acme"                             # team/company name
xenserver_host          = "my-host-ip-or-fqdn"
user                    = "username"
password                = "password"
vm_name                 = "my-vm-name"
x = xmlrpc.client.ServerProxy(
  "http://%s/" % (xenserver_host),
  headers=[ # see https://www.w3.org/TR/trace-context/#traceparent-header
    ('traceparent', '00-%s-%s-01' % (partner_trace_id, partner_request_span_id) ),
    ('tracestate' , '%s=%s' % (partner_name, partner_request_span_id) )
  ] )
s = x.session.login_with_password(user, password)['Value']
vm = x.VM.get_by_name_label(s, vm_name)['Value'][0]
x.VM.shutdown(s, vm)
x.session.logout(s)
Figure 5: Illustrative example of a python 3.9 script from an upstream user or partner, which orchestrates a XenAPI VM.shutdown request with propagation of the W3C TraceContext standard fields traceparent and tracestate
The resulting spans sampled by the XenServer components will then be collected according to the configuration parameters used when creating and enabling the Observer object as described in the previous section. After a few seconds, you should be able to see the sampled spans associated with the VM.shutdown activity present in your endpoint. If you use the same trace_id across several different XenAPI requests, some visualization tools like the Jaeger UI endpoint installed in the previous section will visually group them all together in the same tree of activities. A XenServer host will automatically propagate these fields to all the hosts of the pool used in the execution of the XenAPI request, so you have the complete picture of all activities inside the XenServer pool.
We would like in the future to propagate these fields beyond the XenServer hypervisor to downstream services like storage vendors, network proxies and on-prem/cloud services. If you would like your component to receive a propagation of the traceparent and tracestate fields from XenServer using the W3C TraceContext HTTP protocol standard above (or perhaps a different standard), please contact the XenServer team.
The future: Through the Toolstack and Beyond
In the future, we hope to extend the use of the OpenTelemetry Distributed Tracing, Metrics and Logs standards to further internal XenServer components beyond the XenAPI and the toolstack, including a detailed collection of virtual I/O activities. We would also make use of the OpenTelemetry processor specifications to control the sampling and transformation of specific span activities in each Observer object in the XenAPI. We also would like to correlate all the Distributed Tracing, Logs and Metrics signals generated by XenServer in a solution compatible to the one discussed by the OpenTelemetry Correlation Model.
Feel free to let us know in what types of further Observability capabilities, or tools & standards you’d like our Distributed Tracing implementation to be compatible with you’d find most useful via feedback@xenserver.com.